How does late results reporting relate to a company’s performance?

If you follow results season, you probably watch the numbers: revenue, margins, profit. We watched something duller. The date.
Every listed company gets 45 days after a quarter ends to report results. Say a quarter ends on 30 June: the company has until 14 August. Most finish with time to spare. About one in six reports on 12, 13 or 14 August, right at the end.
So we ran two tests. First, what happens to companies that report at the last minute? We checked 28,900 results from 1,823 actively traded NSE companies, 2015 to 2026. Second, what happens when a company reports earlier or later than it did last year? We checked 23,105 results-date announcements.
The date tells you something. Just not the way most people would guess.
(Two terms we use throughout. Similar stocks means stocks that trade in similar volumes, over the same days, so we’re comparing like with like. Points means percentage points of return compared with those similar stocks. “Trailed by 2.2 points” means the stock did 2.2% worse than similar stocks.)
How we worked it out
We compared each stock with similar stocks over the same days, grouped by when the company reported.
- Last-minute: the meeting fell in the last 3 days of the 45-day window.
- Date moved: the meeting was a week or more earlier, or later, than the same quarter last year.
- Full method at the end.
Part 1: Companies that report at the last minute
Last-minute reporters fell behind over six months
Over the six months after results, companies that reported in the last three days trailed on-time reporters by 2.2 points. Companies that reported after day 45 or postponed trailed by 3.0.
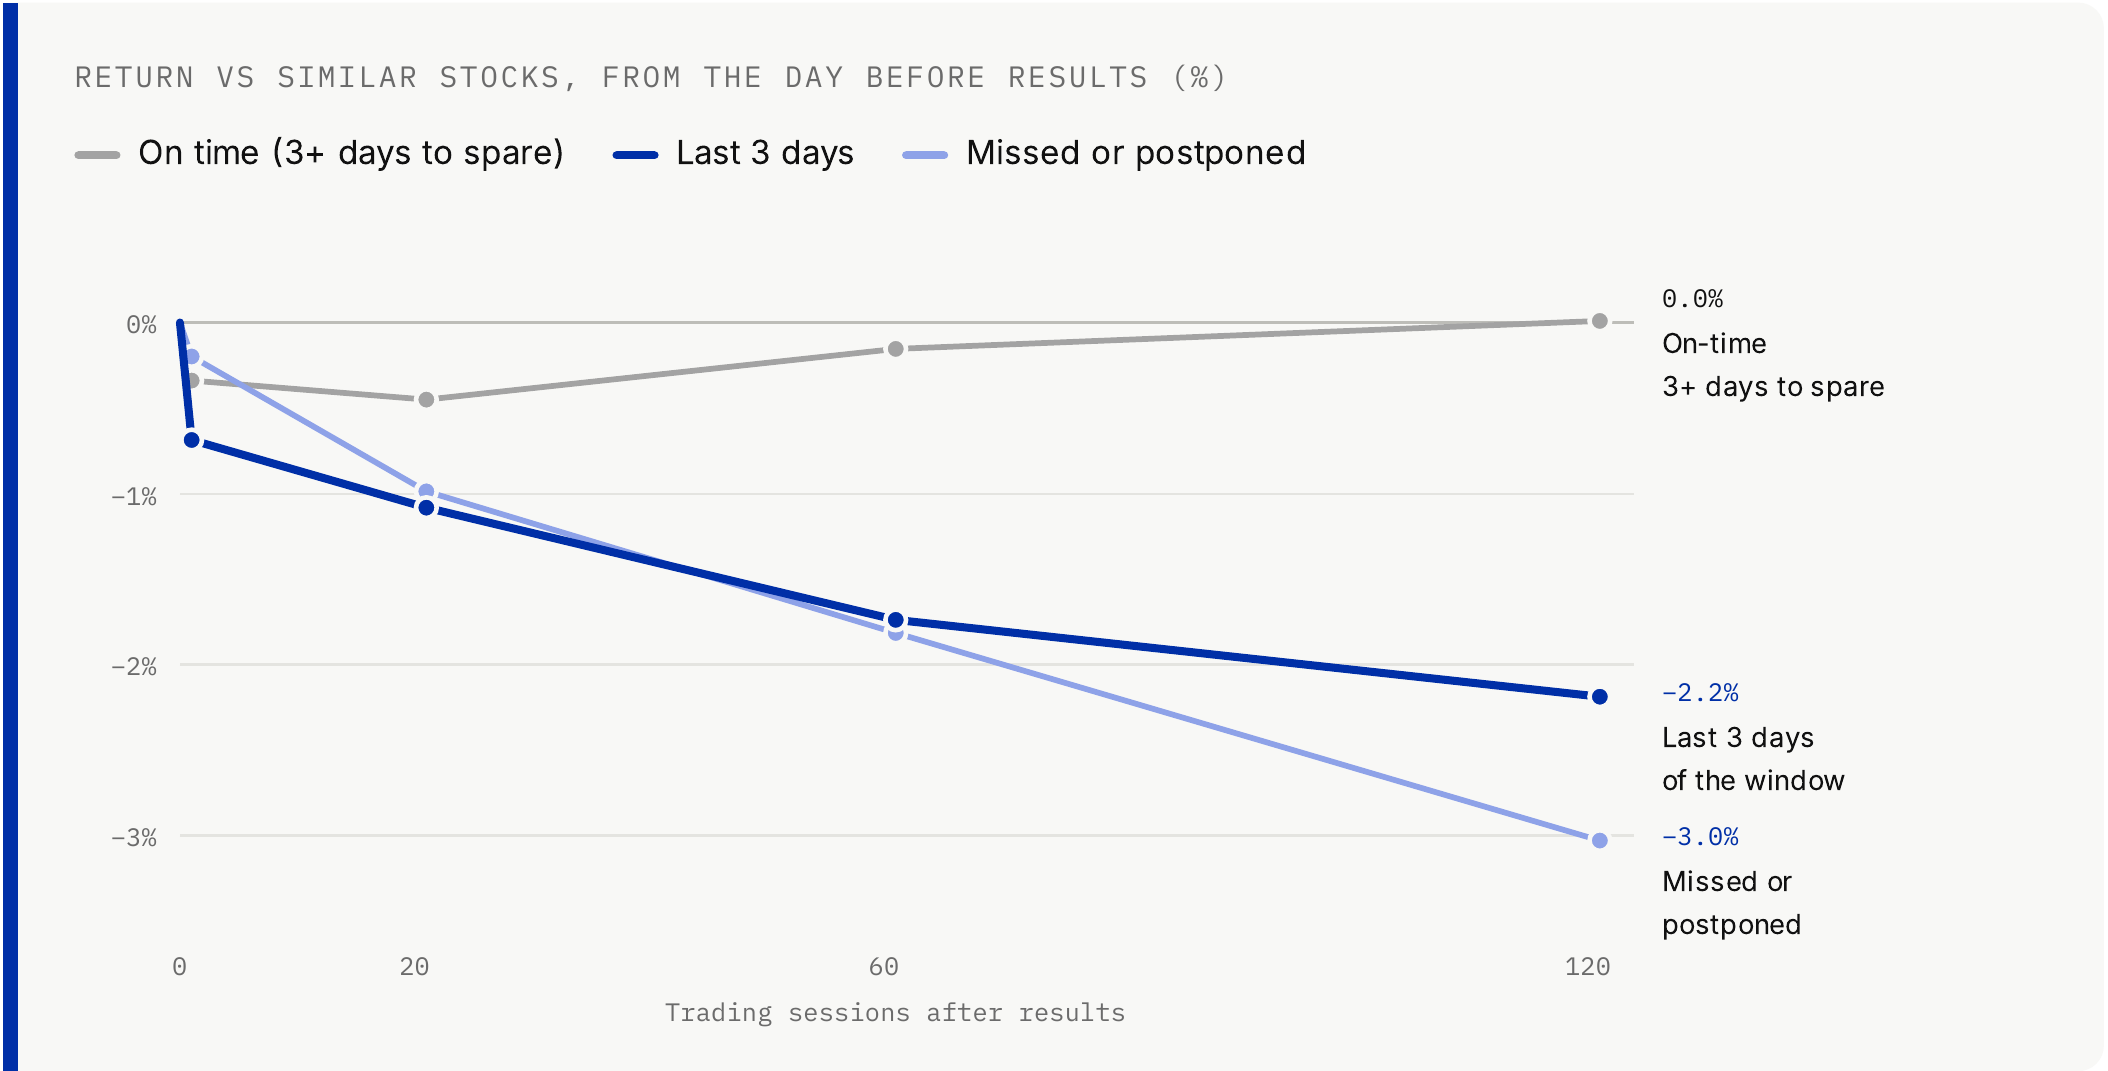
If you held a stock that reported on time, six months later you’d be roughly level with similar stocks. A last-minute reporter would have left you about 2% behind, and that gap builds up over the months rather than arriving in one day.
The damage was slow, not sudden: only about 16% of the gap showed up on results day.
Results-day moves got worse closer to day 45
Most stocks dip a little on results day, so the difference between groups is what matters. The move gets steadily worse as the meeting gets closer to day 45: −0.12% for companies 16+ days early, −0.69% for the last three days.

So the closer a company cuts it to day 45, the worse its stock tends to do on the day results come out. A company reporting with more than two weeks to spare barely dips. One reporting in the last three days dips more than five times as much.
Results that came after day 45 or were postponed show no extra fall on the day, probably because the delay was already public news.
Late reporters didn’t crash more often
A fall of 10% or more on results day was about as common for last-minute reporters as for anyone else.
| Results meeting | Fell 10%+ vs peers | Results |
|---|---|---|
| On time (3+ days to spare) | 3.6% | 23,745 |
| Last 3 days of the window | 3.9% | 4,630 |
| Reported after day 45 or postponed | 2.7% | 525 |
In other words, reporting late doesn’t make a dramatic crash more likely. About 4 in 100 results end in a 10%+ fall either way. The risk with late reporters is the slow drift, not the sudden drop.
Late reporters more often had weaker profits
The later the results, the more likely the company was earning less than a year ago.
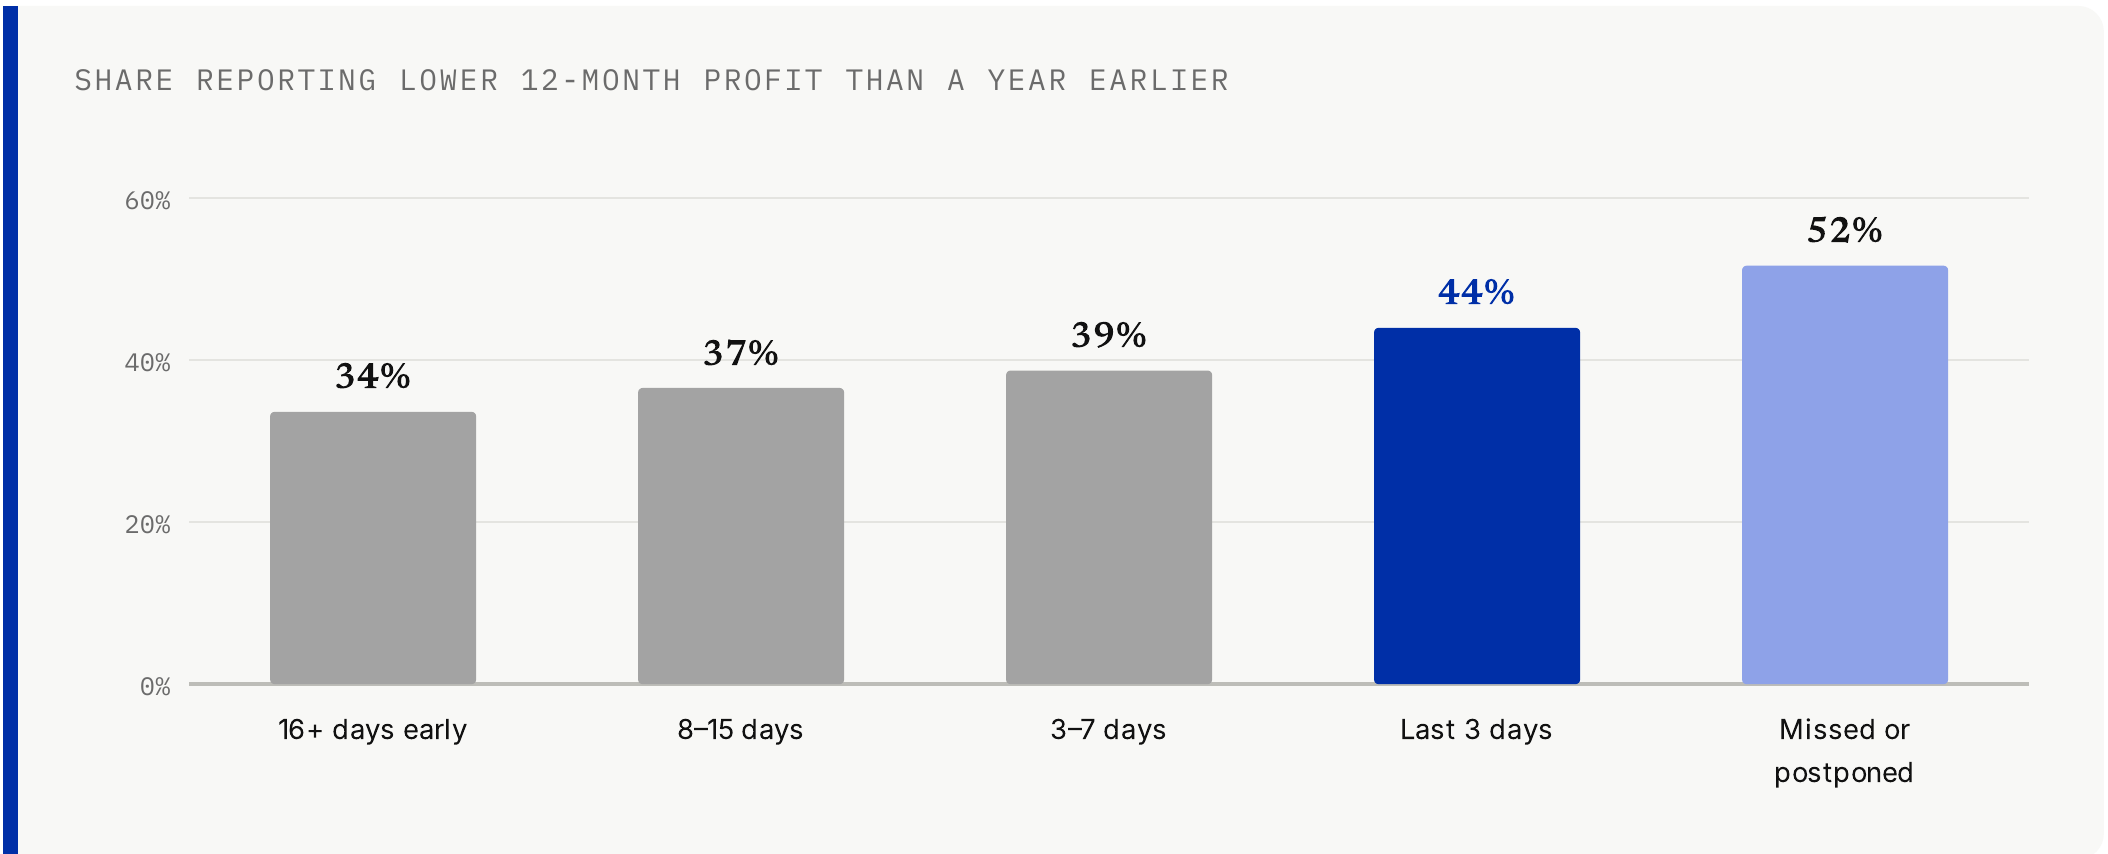
Put simply, the later a company reports, the more likely it has weaker numbers to share. About one in three early reporters earned less than a year before. Among those that reported after day 45 or postponed, it was one in two.
Companies that reported after day 45 or postponed were the only group whose typical profit shrank: −2.5%, against +15.7% for companies that reported 16+ days early.
Repeat late reporters lagged the most
Lateness is sticky. A company late this quarter was late again a year later 48% of the time, against 16% for on-time companies. The lag belongs to the repeat offenders. A company reporting late for the first time did about as well as everyone else.
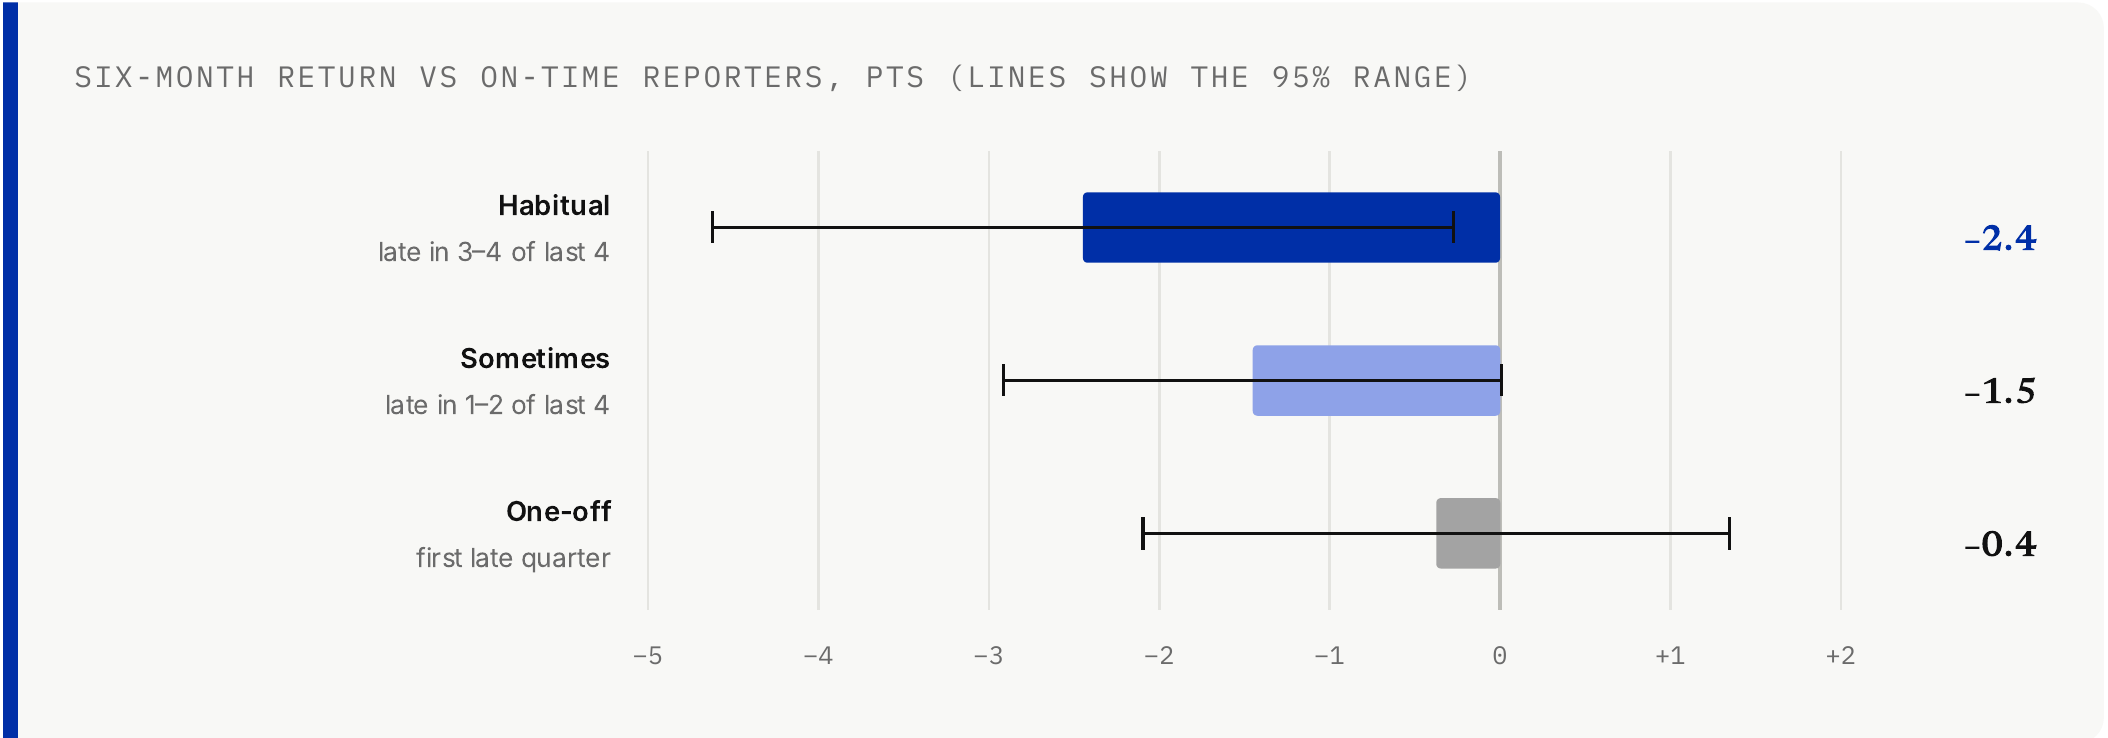
So one late quarter on its own isn’t a warning sign. The thin black line on that bar stretches past zero, which means its small lag could just be chance. A company that reports late quarter after quarter is different: its stock lagged by about 2.4 points, and its line stays clear of zero, so it’s unlikely to be luck.
Delay counts on its own too. Companies that met a week or more later than last year trailed by 1.5 points over six months, even when they still met before the last three days.
The gap was bigger in smaller companies
Large companies, above ₹20,000 crore, rarely report late, only 9% of the time, and when they did their shares didn’t lag (−0.2 pts). The gap was −1.6 pts for ₹3,000–20,000 crore companies and −3.5 pts below ₹1,000 crore.
Some of the worst cases were companies that later went through insolvency, such as DHFL, Reliance Capital and Future Retail.
The gap has been close to zero since 2024

Until 2023, last-minute reporters fell behind in most years. In 2024 and 2025 that stopped. Early 2026 dips again, but it covers only four months of results. So this is a pattern that can switch off, and it shouldn’t be leaned on alone.
One important catch. The gap was large between 2015 and 2023, but close to zero in 2024 and 2025. Only the small results-day dip is still there. 2026 covers January–April results only.
Part 2: Companies that change their results date
Now the other side. A few days before results, every company tells the exchange what date it will report. We compared that date with the date it reported a year earlier.
Companies that brought their date forward by a week or more did better in the days between announcing the date and the results than companies that pushed it back. In 2024–26 they beat similar stocks by 1.11% over about six trading days. Companies that pushed their date back did 0.39%.
To avoid fooling ourselves, we set the rule using 2015–2023 data, then tested it once on 2024–2026.
Companies that moved their date earlier rose more before results
Every company’s stock tends to rise a little in the days before results. The ones that brought their date forward rose the most, in both the older years and the recent ones. The ones that pushed it back rose the least.
Moving the date earlier did better in 11 of 12 years
Year after year, companies that brought their date forward beat those that pushed it back: in 11 of 12 years, including the recent years we kept aside to test the idea. Only 2017 went the other way. The edge is small, usually around 1% or less, and it swings a lot from year to year.
Companies that pushed their date back fell more on results day
On results day itself, the companies that pushed their date back were the ones most likely to disappoint, falling more than everyone else in both periods. The extra fall was about 0.3 points in 2015–23 and 0.2 points in 2024–26, small enough that the recent one could be chance.
Trading costs would take about half the gain
So if you tried to trade this, costs would eat about half of it. Of the 1.11% rise, 0.50% is the bump every company gets before results anyway; the extra from reporting early is 0.61%. Buying and selling a ₹50,000 position costs about 0.60%, leaving 0.51% on average.
And that 0.51% is an average carried by a few big winners. The typical trade lost 0.18% after costs, and fewer than half made money.
The pattern held across large and small stocks
And it isn’t just something that happens in thinly traded small stocks. Split by how actively they trade, companies that moved their date earlier did better in almost every group, with no steady pattern from the least traded to the most traded.
What this means for investors
This isn’t a trading system, and we’d be wary of anyone who sells it as one.
- The last-minute effect has faded. Since 2024, the six-month gap is close to zero.
- Costs eat a lot of it. Buying and selling a ₹50,000 position costs about 0.6%, roughly half the early-date edge. The typical trade lost money after costs.
- One recent year does a lot of the work. Without 2026, the early-date edge for 2024–26 drops to 0.44%.
- It’s noisy for one company. About a third of companies that move their date earlier push it back the next year.
- It’s an average. 39% of last-minute reporters still beat similar stocks over six months, against 43% of on-time reporters.
So treat the date as a question, not an answer. Next time a company you own announces its results date, check it against last year’s. If it slipped a week or more, or the company is a habitual late reporter, read those results a little more carefully.
You can look up any company’s results and filings on Cofacto.
Method, in detail
Results: every quarterly results board meeting announced on NSE, April 2015 to August 2026, including companies later delisted. Last-minute: the meeting date in the company’s first notice fell in the last 3 days of the 45-day window (days 58–60 of the 60-day window for annual results). For annual results the window is 60 days, so “after day 45” means after day 60. Quarters when the regulator extended the 45-day window are left out. Stocks: turnover of at least ₹2 crore a day and price of at least ₹20 on the day before results. Similar stocks: all other liquid stocks with similar trading volume, over the same dates. Prices adjusted for splits, bonuses and dividends. Comparing only companies of similar size and trading volume gives a similar result. Returns before costs and taxes.
Date-change test: first board-meeting notice for each company and quarter, compared with the date the meeting actually happened in the same quarter last year. Returns from the close of the first session after the notice to the last close before the meeting, minus the average of stocks in the same fifth of the market by 60-day traded value. Rule fixed on 2015–2023, tested once on 2024–Sep 2026. Costs: brokerage, STT, exchange and DP charges, half the bid-ask spread each way and a price-impact estimate for a ₹50,000 delivery order. Prices end 1 October 2026. Research on US companies (Johnson and So, Time Will Tell) found a similar link between earlier dates and better results.
Data: NSE board-meeting notices, NSE/BSE daily prices, Cofacto fundamentals. Cofacto research, November 2026.
Not a SEBI-registered Research Analyst or Investment Adviser. This is a historical study, not a recommendation to buy, sell or hold any security, and not investment advice. Companies named are examples of insolvencies, not recommendations. Past patterns may not repeat. Consult a SEBI-registered RA or IA before any investment decision. Complaints cannot be raised with SEBI for this content. Built with AI from public data; it may be incomplete or incorrect.
Ask about this
Ask Cofacto a question about this piece. Answers cite filings and company data.
More in Research
- The curious case of Taparia ToolsAlso on Cofacto
- Ola needs 2.6x today’s sales to cover its running costs. We ran the numbers.Also on Cofacto
- How much of India Inc's Q2 FY27 growth came from oil and war prices?Also on Cofacto